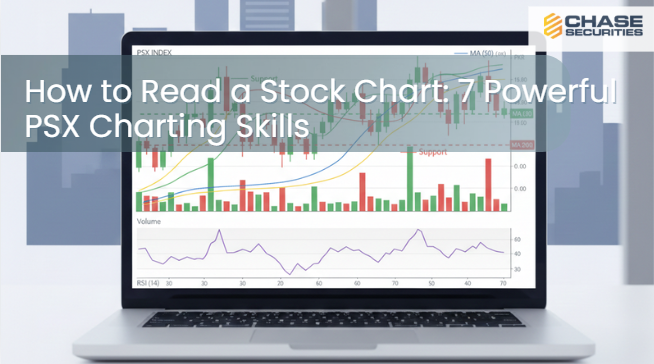
How to Read a Stock Chart: A Comprehensive Guide for PSX Investors
How to read a stock chart is one of the most essential skills for investors and traders on the Pakistan Stock Exchange (PSX). Stock charts condense price history, investor behaviour, and technical structure into visual maps that help you make better decisions in a volatile market like Pakistan.
In this guide we’ll cover:
- what stock charts show and why they matter
- key chart types (line, bar, candlestick) and how to read them
- timeframes and how PSX-specific dynamics affect chart interpretation
- fundamental chart tools: trend, support/resistance, volume, indicators
- how to apply these in a PSX context (members, data sources, caution)
- common pitfalls & how to avoid them
- a quick actionable checklist
Why Learning How to Read a Stock Chart Matters for PSX Investors
A stock chart shows how a stock’s price (and sometimes volume) has moved over time. Charts help you spot patterns, determine whether prices are trending or range-bound, and make better-timed decisions.
For PSX investors:
- The market can be more volatile due to currency risk, regulatory shifts and macro factors → charts help you visualise that volatility.
- PSX and local charting/data platforms (for example via PSX Data Portal) provide price & volume history.
- Liquidity, free-float constraints and intraday behaviour matter more than in some larger markets → chart reading can help identify where “action” is happening.
Charts don’t replace fundamentals (business model, earnings) but they complement them by showing how the market is behaving. PSX Data Portal provides historical price and volume data.
How to Read a Stock Chart: Understanding Chart Types
Line Chart
- Simplest form: plots closing prices over time, connected by a line.
- Good for seeing broad trend (upward, sideways, downward).
- Limitation: doesn’t show high/low, volume or intraday movement.
Bar Chart / OHLC (Open-High-Low-Close)
- Each “bar” shows four values: open, high, low, close for the period (day, week, hour).
- Useful to see range and volatility of each period.
Candlestick Chart
- Most popular for technical analysis. Each “candle” shows open/close (body) and high/low (wicks).
- Colour-coded (often green for up-close, red for down-close) to show momentum visually.
- Great for spotting reversal patterns, momentum shifts.
Heikin-Ashi / Other variants
- Smoothed charts, less “noise”, show trend strength.
- Useful when you want to filter smaller fluctuations.
On PSX, candlestick and bar charts are widely available (via charting platforms, broker portals). Understanding them is priority.
Timeframes, trends & PSX particularities
When reading charts you must consider which timeframe you’re looking at and what trend you’re focusing on.
Short-term charts (intraday, minutes, hours)
- Useful for traders. On PSX, intraday volume and momentum can matter strongly when few major players are active.
- But higher noise → requires caution.
Medium-term charts (daily, weekly)
- Useful for most investors. Shows how a stock is behaving over weeks-months, and reveals trend shifts, breakout points.
- On PSX you’ll often look at daily bars/candles, weekly aggregates to see stability/volatility.
Long-term charts (monthly, multi-year)
- Help you understand overall trend, structural support, business cycle.
- Example: PSX index charts show broad cycles, but individual stocks may diverge.
Trend analysis
- Uptrend: higher highs & higher lows.
- Downtrend: lower highs & lower lows.
- Sideways (range): price fluctuates between support & resistance.
- On PSX, currency, policy or macro shocks may cause abrupt shifts in trend, charts help you spot when that happens.
Key chart tools: what to look for
Support & Resistance
- Support = price level where buyers historically step in and halt a decline.
- Resistance = price level where sellers step in and halt a rise.
- In PSX stocks: support/resistance can be influenced by round numbers, historic lows/highs, previous consolidation zones.
- Example: if a stock repeatedly bounces around PKR X, that becomes a support zone; when it approaches PKR Y it stalls, that’s resistance.
Volume
- Volume shows how much trading activity occurred in a period. A price move with low volume is less reliable; one with high volume is more meaningful.
- On PSX, low free-float stocks may show erratic volume jumps; be cautious. Charting platform such as Stock Intel show volume with price.
Moving Averages (MA)
- Simple MA (SMA), Exponential MA (EMA) show average price over recent periods (e.g., 20-day MA, 50-day MA).
- Helps smooth out noise, show trend direction.
- On PSX, you might use a 100-day or 200-day MA for longer term investors.
Oscillators & Indicators (RSI, MACD, etc.)
- RSI (Relative Strength Index): measures speed/magnitude of recent price changes to identify over-bought or over-sold states.
- MACD (Moving Average Convergence Divergence): shows relationship between two moving averages, helps signal momentum shifts.
- On PSX, these are available via platforms like TradingView.
- These indicators must be used with caution: they lag or may give false signals in low-liquidity stocks.
Patterns (chart formations)
- Head & Shoulders, Double Top/Bottom, Triangles, Flags. These formations indicate potential reversal or continuation. Schwab covers many.
- On PSX, where data history may be shorter or less consistent, confirm pattern with volume and broader context.
How to Read a Stock Chart in Pakistan: Practical PSX Application
Here’s how to make chart reading effective in a Pakistan context:
-
Use local data sources
- Use PSX Data Portal for up-to-date price/volume data.
- Use platforms like Stock Intel for technicals in PSX stocks.
- Check liquidity: low volume stocks may generate misleading patterns.
-
Adjust for local market behavior
- PSX sessions, lunch breaks, settlement cycles may differ from foreign markets; intraday charts may behave differently.
- Macro events (currency devaluation, policy shifts, global shocks) may cause abrupt gaps in charts, treat gaps seriously.
- Free-float and company-specific events can distort volumes/trends.
-
Cross-check with fundamentals
- A chart may show an up-trend, but if the company’s fundamentals are deteriorating, the risk is higher.
- Use chart signals as supporting data, not sole basis for decision.
-
Define risk controls
- Determine stop-loss levels based on support zones visible on the chart.
- Define profit-targets based on resistance levels or trend-projections.
- On PSX, volatility can be high, so stop-loss must consider typical price swings, not just arbitrary small numbers.
-
Use multiple time-frames
- For example: look at weekly chart for trend, daily chart for entry timing, intraday chart for execution if you’re trading.
Common Mistakes When Learning How to Read a Stock Chart
- Over-relying on patterns without volume verification on PSX especially, pattern may appear but volume is thin.
- Ignoring chart context looking only at short timeframe when broader trend is negative.
- Relying on chart only, ignoring fundamentals a strong chart doesn’t guarantee business health.
- Misinterpreting gaps in PSX, gaps may be due to corporate actions or low liquidity, not only trend change.
- Using indicators blindly especially in low-float stocks, indicators can give misleading signals.
Quick Checklist: How to Read a Stock Chart (PSX Edition)
- Choose the timeframe (daily/weekly/monthly) based on your horizon.
- Identify the prevailing trend (higher highs/lower lows or range).
- Mark key support and resistance levels from past behaviour.
- Check volume, rising price with rising volume is stronger than without.
- Overlay moving averages to confirm trend direction.
- Use RSI/MACD (or other indicators) to assess momentum and possible reversal.
- Look for credible chart patterns (triangle, head & shoulders, breakout) and validate with volume.
- Align chart signal with fundamentals, business, sector, macro.
- Define entry, stop-loss and target based on chart levels.
- Re-review periodically (especially after major events) and adjust.
Conclusion
Learning how to read a stock chart is a skill, not a one-time task. On PSX, it becomes even more valuable: you get visual clarity in a market that can feel noisy, you spot opportunities or risk earlier, and you connect behaviour (price + volume) with business reality. Use charts wisely, not as fortune-telling devices, but as tools that improve your decision making.
When you learn how to read a stock chart, you stop reacting emotionally and start responding logically to price behaviour. At Chase Securities Pakistan Private Limited, we encourage you to pair chart-reading with strong business understanding and risk discipline. Whether you’re a long-term investor or active trader, mastering charts helps you stay ahead of the crowd.