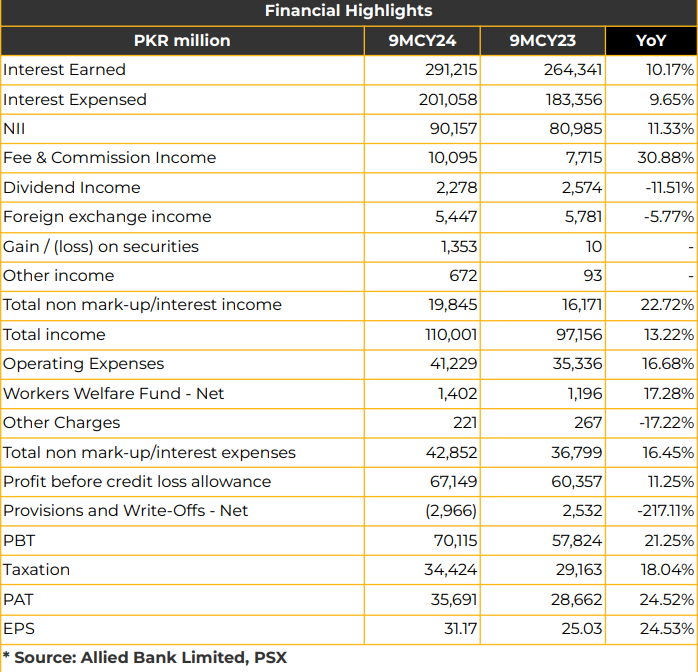
In 9MCY24, Allied Bank Limited (ABL) saw a net profit of PKR 35.69 billion (EPS: PKR 31.17), a 25% YoY increase from the PKR 28.66 billion net profit (EPS: PKR 25.03) in the SPLY.
The bank’s 9MCY24 revenue reached PKR 110 billion, indicating a 13% YoY growth from the PKR 97.16 billion reported in the previous year.
During 9MCY24, NII increased by 11% YoY to PKR 90.16 billion, while non-markup income rose by 23% YoY to PKR 19.84 billion due to a 31% increase in fee & commission income, gain on securities (PKR 1.35 billion), primarily due to investment in Eurobnds, and other income (PKR 672.22 million). ABL operates 1,352 branches across Pakistan, including 140 Islamic and 14 digital branches.
The management aims to expand its Islamic branch network by opening and reaching 150 branches by the end of CY24. Total assets of the bank increased by 13% YoY to PKR 2,624 billion as of June 30, 2024. Cash, bank balances, and lending to financial institutions grew by 11% to PKR 186 billion, significantly higher than the industry’s decline of 7%. Investments saw a 16% increase to PKR 1,333 billion, compared to the industry’s 21% growth.
However, advances increased by 8% to PKR 848 billion, against the industry’s decline of 2% in 1HCY24. Total deposits increased by 15% YoY to PKR 1,924 billion, aligning with industry growth, with CASA standing at 82% in 9MCY24. Total equity grew by 18% YoY to PKR 230 billion, up from PKR 194 billion as of December 31, 2023. The CAR improved to 32.43% as of September 30, 2024, compared to 26.21% in CY23. Conversely, total liabilities increased by 12% YoY, reaching PKR 2,394 billion in 9MCY24.
The ROA and ROE were recorded at 1.50% (down from 1.78% in CY23) and 29% (compared to 29.40% in CY22), respectively. ABL’s gross ADR increased to 44.72% in 9MCY24, higher than the industry average.
Management aims to achieve a 50% ADR target by the end of CY24. The deposit composition of ABL is made up of 37% current deposits, 45% saving deposits, and 18% term deposits, giving the bank a 6% market share in deposits. Non-performing loans (NPLs) are reported at PKR 12.9 billion, reflecting a 1% YoY decline, with an NPL ratio of 1.50%. Specific NPL coverage stands at 93.9%, while overall NPL coverage is at 107.29%.
The key lending sectors include non-financial public sector enterprises, NBFIs, government, textiles, information & communication, and non-metallic minerals.
Management attributed the recent trend of provision reversals to the sale of Eurobonds. In 9MCY24, the investment portfolio comprises 81% in PIBs (with fixed PIBs under 10%), 12% in T-Bills, 1% in listed and unlisted shares, and 6% in other investments. Investment in PIBs rose by 6%, while investments in subsidiaries surged 200%. T-Bill investments increased by 161%, but listed and unlisted shares fell by 22%. Investments in fixed TFCs, bonds, and Sukuks declined by 5%. ABL’s app has registered 2 million users, with 3.4 million cards in circulation. Digital transactions now represent 83% of total transactions, supported by 23 digital touchpoints. Going forward, management anticipates improving current account deposits, with an expected deposit growth of 10-12% in CY24. However, ABL expects the trend of provision reversals to continue through CY24 and into the next year.
Additionally, ABL foresees pressure on margins due to an anticipated drop in interest rates, with a projected decline of 100-150 bps, reaching 13.5% by the end of CY24 and 11% by June 2025. Furthermore, management aims to achieve low-cost deposits moving forward. Current deposits are aimed to increase by 15-20%, focusing on sticky deposits. Management expects the advances to increase slightly, primarily for working capital requirements and auto finance.

Important Disclosures
Disclaimer: This report has been prepared by Chase Securities Pakistan (Private) Limited and is provided for information purposes only. Under no circumstances, this is to be used or considered as an offer to sell or solicitation or any offer to buy. While reasonable care has been taken to ensure that the information contained in this report is not untrue or misleading at the time of its publication, Chase Securities makes no representation as to its accuracy or completeness and it should not be relied upon as such. From time to time, Chase Securities and/or any of its officers or directors may, as permitted by applicable laws, have a position, or otherwise be interested in any transaction, in any securities directly or indirectly subject of this report Chase Securities as a firm may have business relationships, including investment banking relationships with the companies referred to in this report This report is provided only for the information of professional advisers who are expected to make their own investment decisions without undue reliance on this report and Chase Securities accepts no responsibility whatsoever for any direct or indirect consequential loss arising from any use of this report or its contents At the same time, it should be noted that investments in capital markets are also subject to market risks This report may not be reproduced, distributed or published by any recipient for any purpose.

