
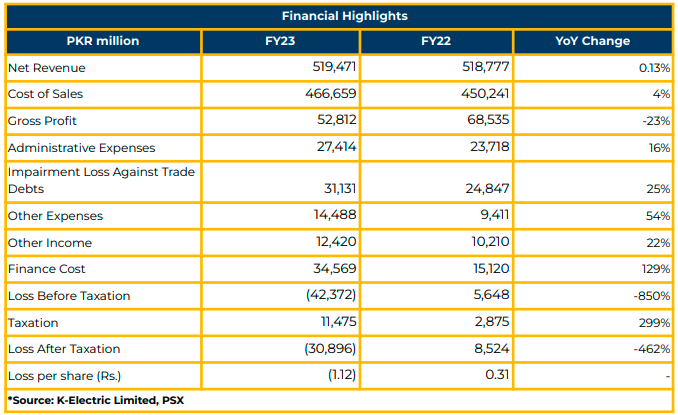
In FY23, K-Electric Limited reported a net loss of PKR 30.89 billion (LPS: PKR 1.12), in contrast to the net profit of PKR 8.52 billion (LPS: PKR 0.31) in the corresponding period the previous year.
The company’s top line witnessed a marginal 0.13% YoY increase, totaling PKR 519.47 billion in FY23, compared to PKR 518.78 billion in SPLY. However, the gross profit experienced a decline of 23%, amounting to PKR 52.81 billion in FY23, down from PKR 68.54 billion in SPLY.
Impairment losses declined by 25% YoY to PKR 31.13 billion in FY23, attributed to higher inflation, tariffs, and lower consumer propensity to pay. An exchange loss of PKR 4.38 billion was incurred due to significant exchange devaluation. Conversely, other income increased by 22% YoY to PKR 12.42 billion, driven by income from bank deposits, late payment surcharges, and TDRs.
KEL’s EBITDA declined by 60% YoY to PKR 16.49 billion in FY23, compared to PKR 41.59 billion in SPLY. Total assets decreased by 3% YoY to PKR 1.02 trillion in FY23, while total equity increased by 2% YoY to PKR 255.16 billion.
The finance cost of the company increased by 129% YoY to PKR 34.57 billion in FY23, compared to PKR 15.12 billion in FY22, attributed to the rise in the weighted average cost of borrowing (18.6%). Overall borrowing increased by 9.4% YoY during the same period.
KEL’s own generation capacity was reported at 2,817 MW, supplemented by an additional 1,600 MW sourced from external providers.
The transmission capacity of Karachi Electric is 6,965 MVAs, with 71 grids, 181 Power Trafos, and 1,354 KM of lines. The distribution capacity is 8,808 MVAs, with 2,068 feeders, 31,261 distribution tariffs, and 10,891 KM of HT lines.
Despite a 7.3% YoY decline in sent-out units to 18,356 GWh units, KEL maintained its T&D losses at 15.3%, in line with the benchmark set by NEPRA. The industrial slowdown and increased instances of power theft posed challenges amd contributed towards the decline in power demand.
In FY23, KEL commissioned two units (Unit 1 and Unit 2) of the 900MW RLNG-fired power plants, BQPS-III, with commercial operations commenced in 3QFY23. This improved the generation efficiency by 3.6pp to 42.2% in FY23 from 38.6% in FY22.
The recovery ratio declined to 92.8% in FY23 from 96.7% in FY22, attributed to lower purchasing power, higher fuel cost adjustments, consumer-end tariffs, and higher.
Despite facing challenges, KEL reported a reduction in transformer and grid equipment trips since FY12 and undertook infrastructure enhancements, including rehabilitating over 450 KM of old circuit length and increasing EHT lines by around 106KM since FY12.
Due to fixed tariffs set by NEPRA for a Multi-Year Tariff and Investment Plan 2017-2023, KEL incurred contribution losses of PKR 12.2 billion in FY23, compared to PKR 98.8 billion in SPLY.
The total receivables stand at PKR 36 billion from government entities, with a mediation agreement initiated for government payments.
KEL has submitted a summary for power supply from the national grid, initiated a TDS agreement, and plans to add 1,282 MW of renewables by 2030.
The management discussed a Multi-Year Tariff and Investment Plan 2023 with an investment of PKR 484 billion, intending to increase generation capacity, solar power generation, and reduce distribution losses. A separate tariff determination petition for each business (Generation, Transmission, Distribution) is under NEPRA consideration.
Going forward, K-Electric aims to enhance operational efficiencies and transition towards renewables to ensure an uninterrupted electricity supply.
Important Disclosures
Disclaimer: This report has been prepared by Chase Securities Pakistan (Private) Limited and is provided for information purposes only. Under no circumstances, this is to be used or considered as an offer to sell or solicitation or any offer to buy. While reasonable care has been taken to ensure that the information contained in this report is not untrue or misleading at the time of its publication, Chase Securities makes no representation as to its accuracy or completeness and it should not be relied upon as such. From time to time, Chase Securities and/or any of its officers or directors may, as permitted by applicable laws, have a position, or otherwise be interested in any transaction, in any securities directly or indirectly subject of this report Chase Securities as a firm may have business relationships, including investment banking relationships with the companies referred to in this report This report is provided only for the information of professional advisers who are expected to make their own investment decisions without undue reliance on this report and Chase Securities accepts no responsibility whatsoever for any direct or indirect consequential loss arising from any use of this report or its contents At the same time, it should be noted that investments in capital markets are also subject to market risks This report may not be reproduced, distributed or published by any recipient for any purpose.